
Habitat Connectivity Modelling
About The Project
Habitat connectivity describes how easily wildlife can move between the places they need to feed, breed, and shelter. When landscapes become fragmented, populations are isolated, biodiversity declines, and ecosystems become less resilient. Improving connectivity helps restore functional ecological networks, allowing species to move, thrive, and adapt to environmental change.
We are mapping habitat connectivity across the Weald to Waves corridor and the wider Sussex landscape using five Champion Species that represent the needs of a wide range of wildlife. This evidence-led approach helps guide habitat creation and restoration where it will have the greatest impact, supporting biodiversity recovery and a healthier, more connected landscape.
Project Aims
Identify areas of habitat fragmentation
Direct habitat creation and restoration efforts in the corridor
Identify potential areas for green infrastructure to improve connectivity
Highlight opportunities to link the urban environment with the farmed landscape

Understanding the Landscape From the Eyes of Wildlife
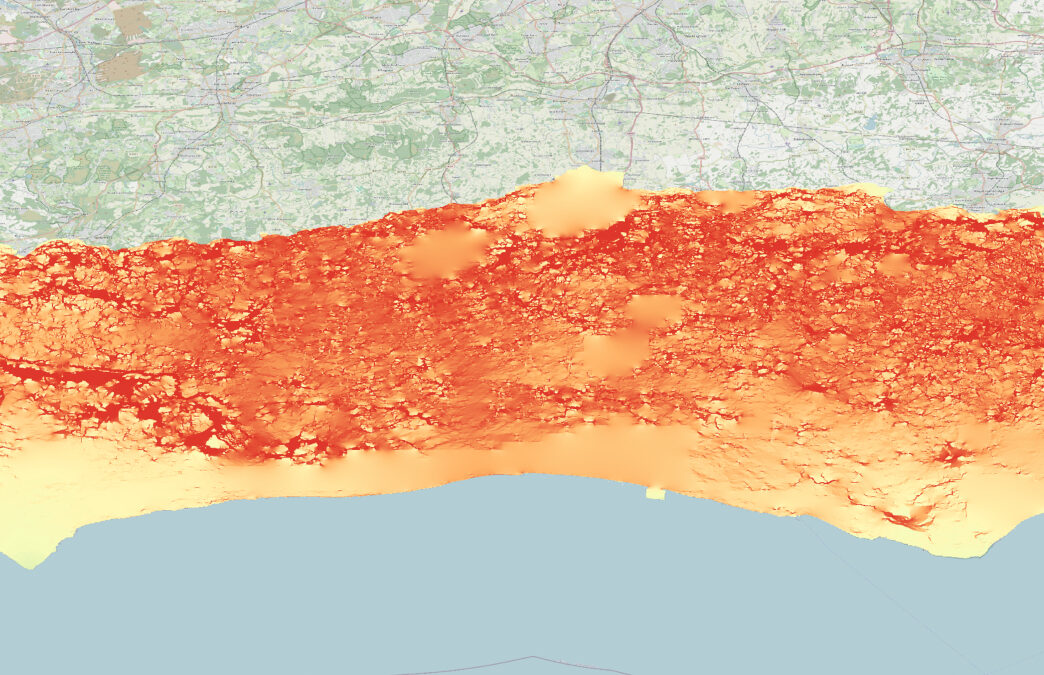
Our Habitat Connectivity Modelling uses modelling techniques to map and understand how wildlife moves across Sussex. By combining land use data, the movement behaviour of our “Champion Species”, and pressures such as light pollution and roads, we can pinpoint areas where habitat fragmentation is limiting wildlife movement.

Hedgehogs

Frogs and Toads

Butterflies

Adders

Bats

Representing many species...
The Science Behind the Maps
To assess habitat connectivity across the landscape, we applied two complementary spatial models:
Connectivity Pathways

Connectivity pathways are identified using land cover data. By mapping how permeable different habitats and land uses are for a range of species, we can predict movement pathways across the wider landscape.
Bottlenecks

Bottlenecks are identified using behavioural information, where species movement is limited to small corridors due to habitat fragmentation, potentially causing population isolation.
A Collaborative Effort
The success of these projects has been thanks to our amazing partners, who have contributed their expertise and resources to the scheme. Without them, nature recovery on a landscape scale would not be possible.


