


New Connectivity Model
By Alex Briggs - 16 May 2025
Since the Weald to Waves project was started in 2022 we have had the challenge not only to create a wildlife corridor, but to identify what connectivity means on the ground.
The driving idea behind the need for corridors came from the report “Making Space for Nature” by John Lawton back in 2010, which stated that to reverse declines in biodiversity we need to tackle habitats that are too small and too isolated for wildlife to survive. Instead, we need “bigger, better and more joined up”.
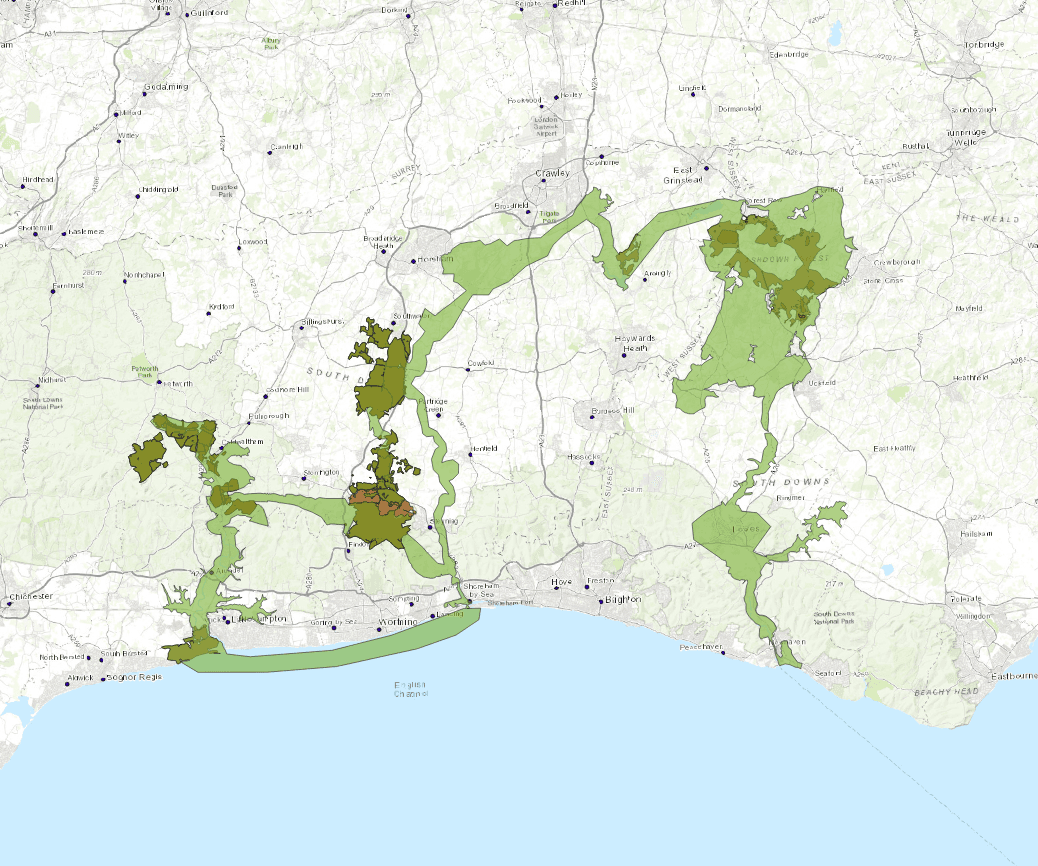
Mapping the corridor
When we originally mapped the 100 mile route of Weald to Waves, we chose a route that followed the best opportunities for connectivity: following rivers, connecting nature reserves, conservation projects and designated sites. Equally as important was including the human opportunity, ensuring our 77,000 hectare catchment area included communities and land managers already working hard for nature recovery, to support the amazing achievements already happening across Sussex. Together, ecological and social data gave us a route across Sussex where we could focus our efforts.
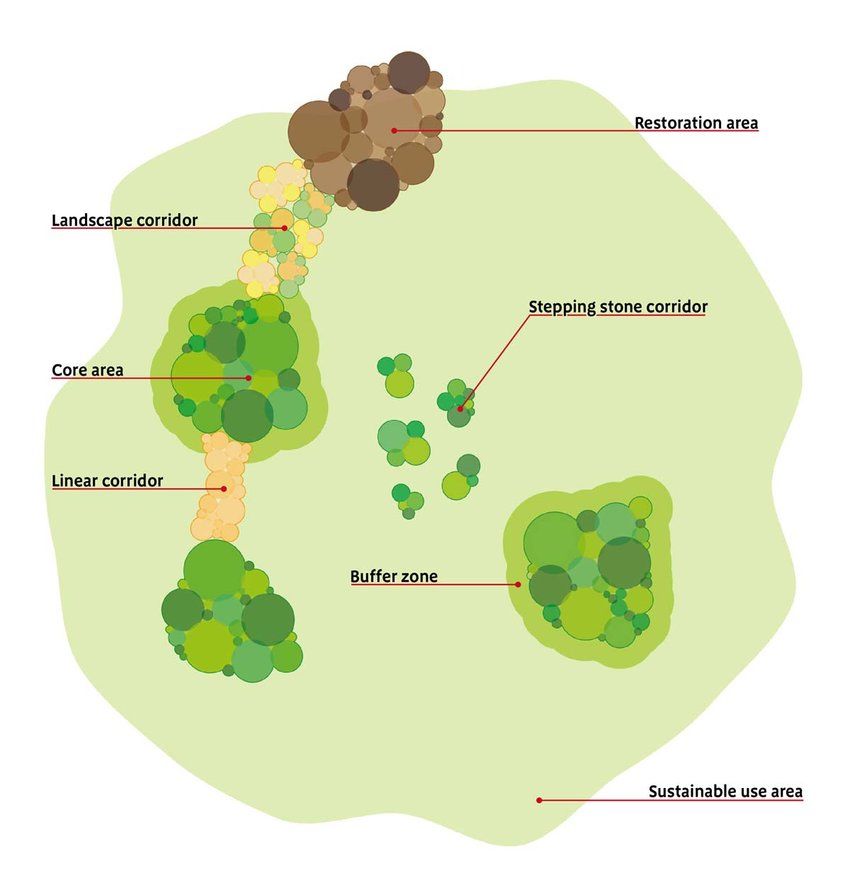
Defining connectivity
To create a corridor, we need to be able to identify well-connected and isolated habitats, and measure this as we work to improve connectivity. Locally this is fairly easy, we can survey for good quality habitats and ensure they are appropriately joined up with physical linear features such as hedgerows, or with stepping stone features such as ponds. However, on a landscape scale this can be much more complicated. We’ve been very excited to work with Nature Data Solutions over the past few months to define connectivity in the corridor and beyond. One of the most important and challenging considerations in answering this question is the behaviour of the species we are trying to benefit. Increasing connectivity means different things depending on the species lens through which we view the landscape, from reducing the invisible barriers created by light pollution for bats, to creating ponds within the known dispersal distances of amphibians.
Yet more complexities…
Of course, we aren’t trying to create an amphibian corridor, or a bat highway. The challenge is to consider the behaviour of a range of wildlife to meaningfully improve habitat connectivity and ecosystem health.
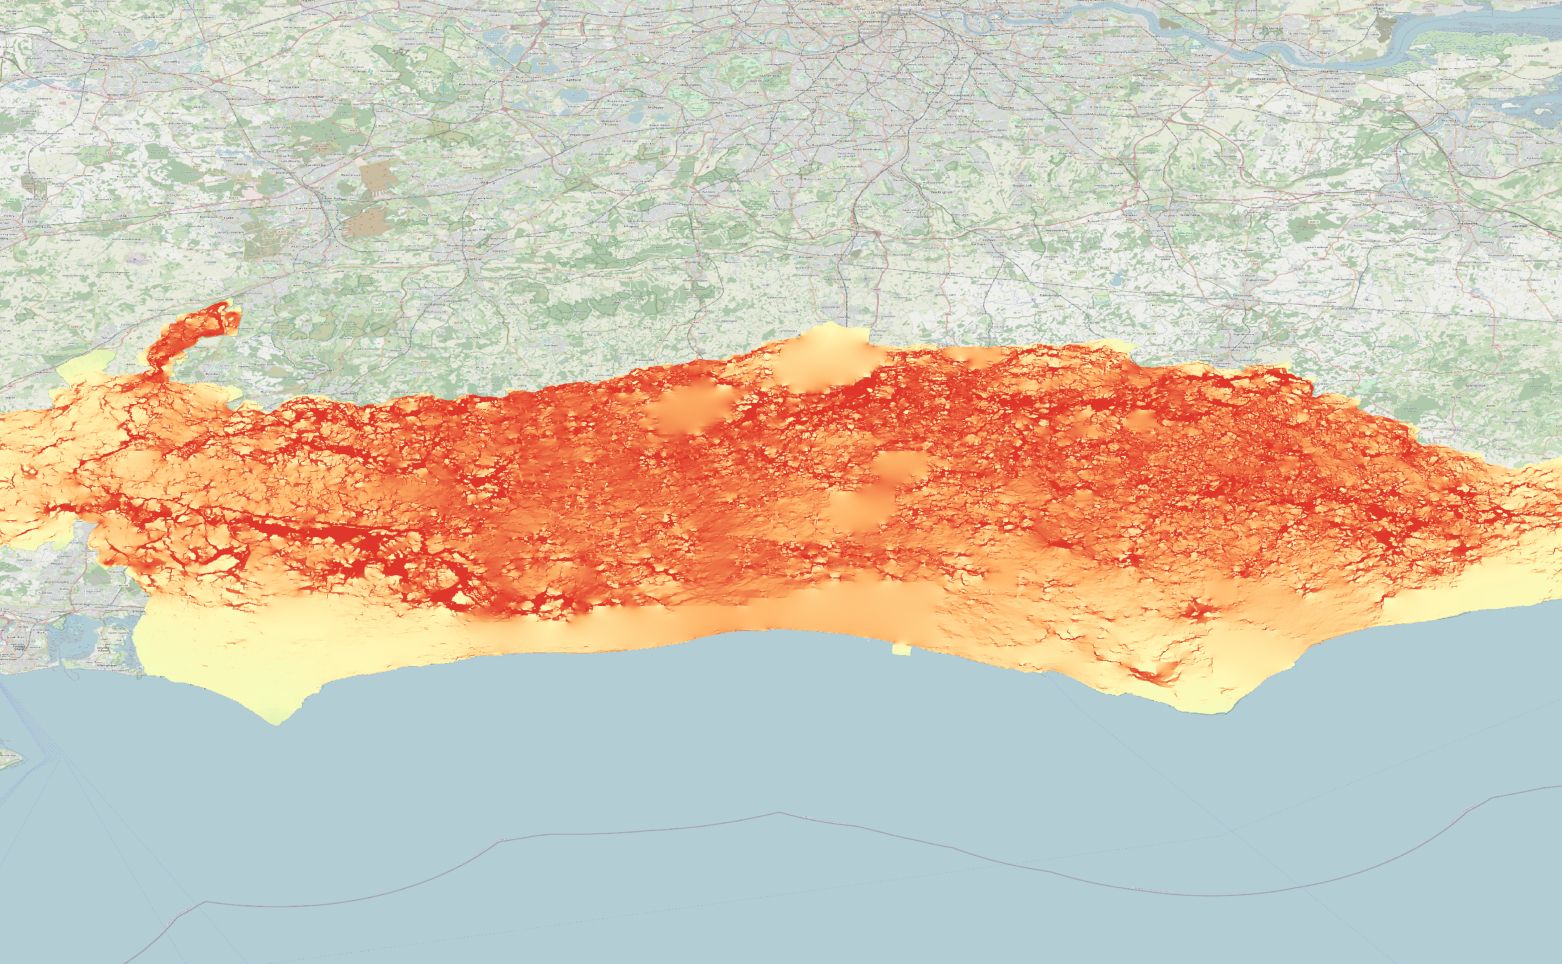
Using a multitude of datasets, including habitat data mapped by our Landscape Advisor working with land managers along the corridor, along with satellite-derived land use data, we have created a complex land cover map of Sussex. Taking this map, we have taken the known dispersal abilities of a range of target species that represent wider guilds of species, such as Bechstein's bats and common frogs, while classifying the land cover according to how "permeable" it is to each species.
What we have created are maps that show potential pathways for connectivity for these species, how well connected they are, and where there is fragmentation and bottlenecks. The results of these maps help to demonstrate what connectivity may look like across Sussex for a wide range of species affected by habitat fragmentation.
The next steps are putting all of this data to good use, and we plan to work both locally with land managers and communities to create habitats, and with our partners to reduce fragmentation across the landscape.
With huge thanks to Nature Data Solutions, the South Downs National Park Authority and the Sussex Wildlife Trust for their support!